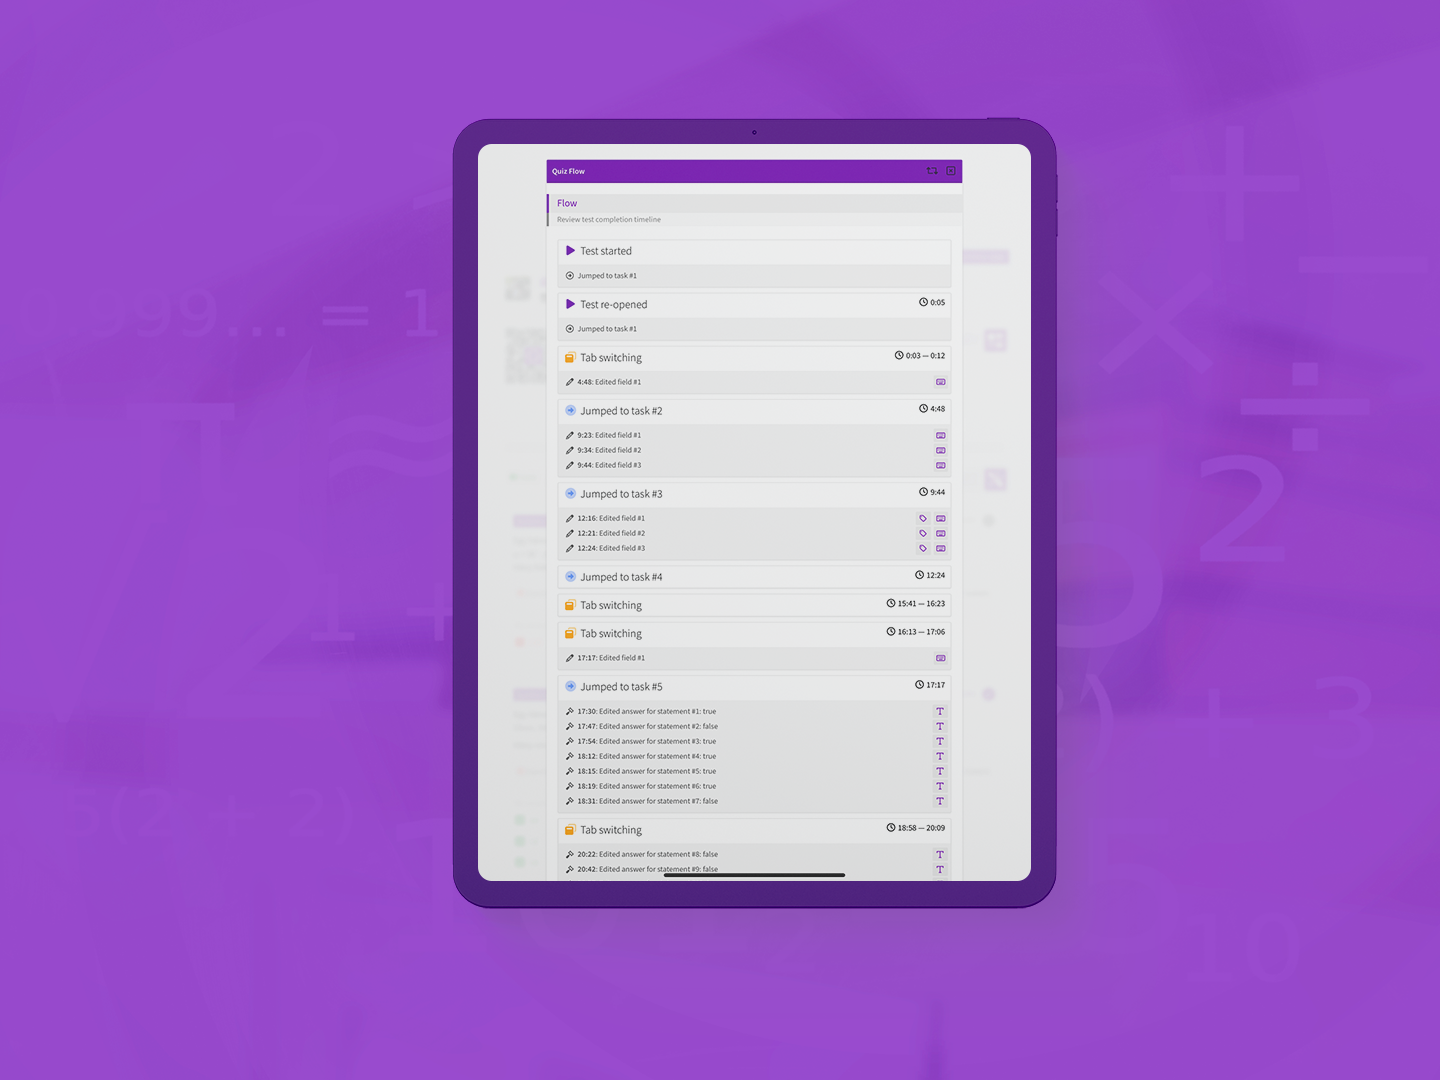
Quiz Flow - Understand what is happening during your tests

Have you ever wondered as an educator what you students are exactly doing during your test? Or the same with your employees or customers, taking a critical test?
System built on metrics
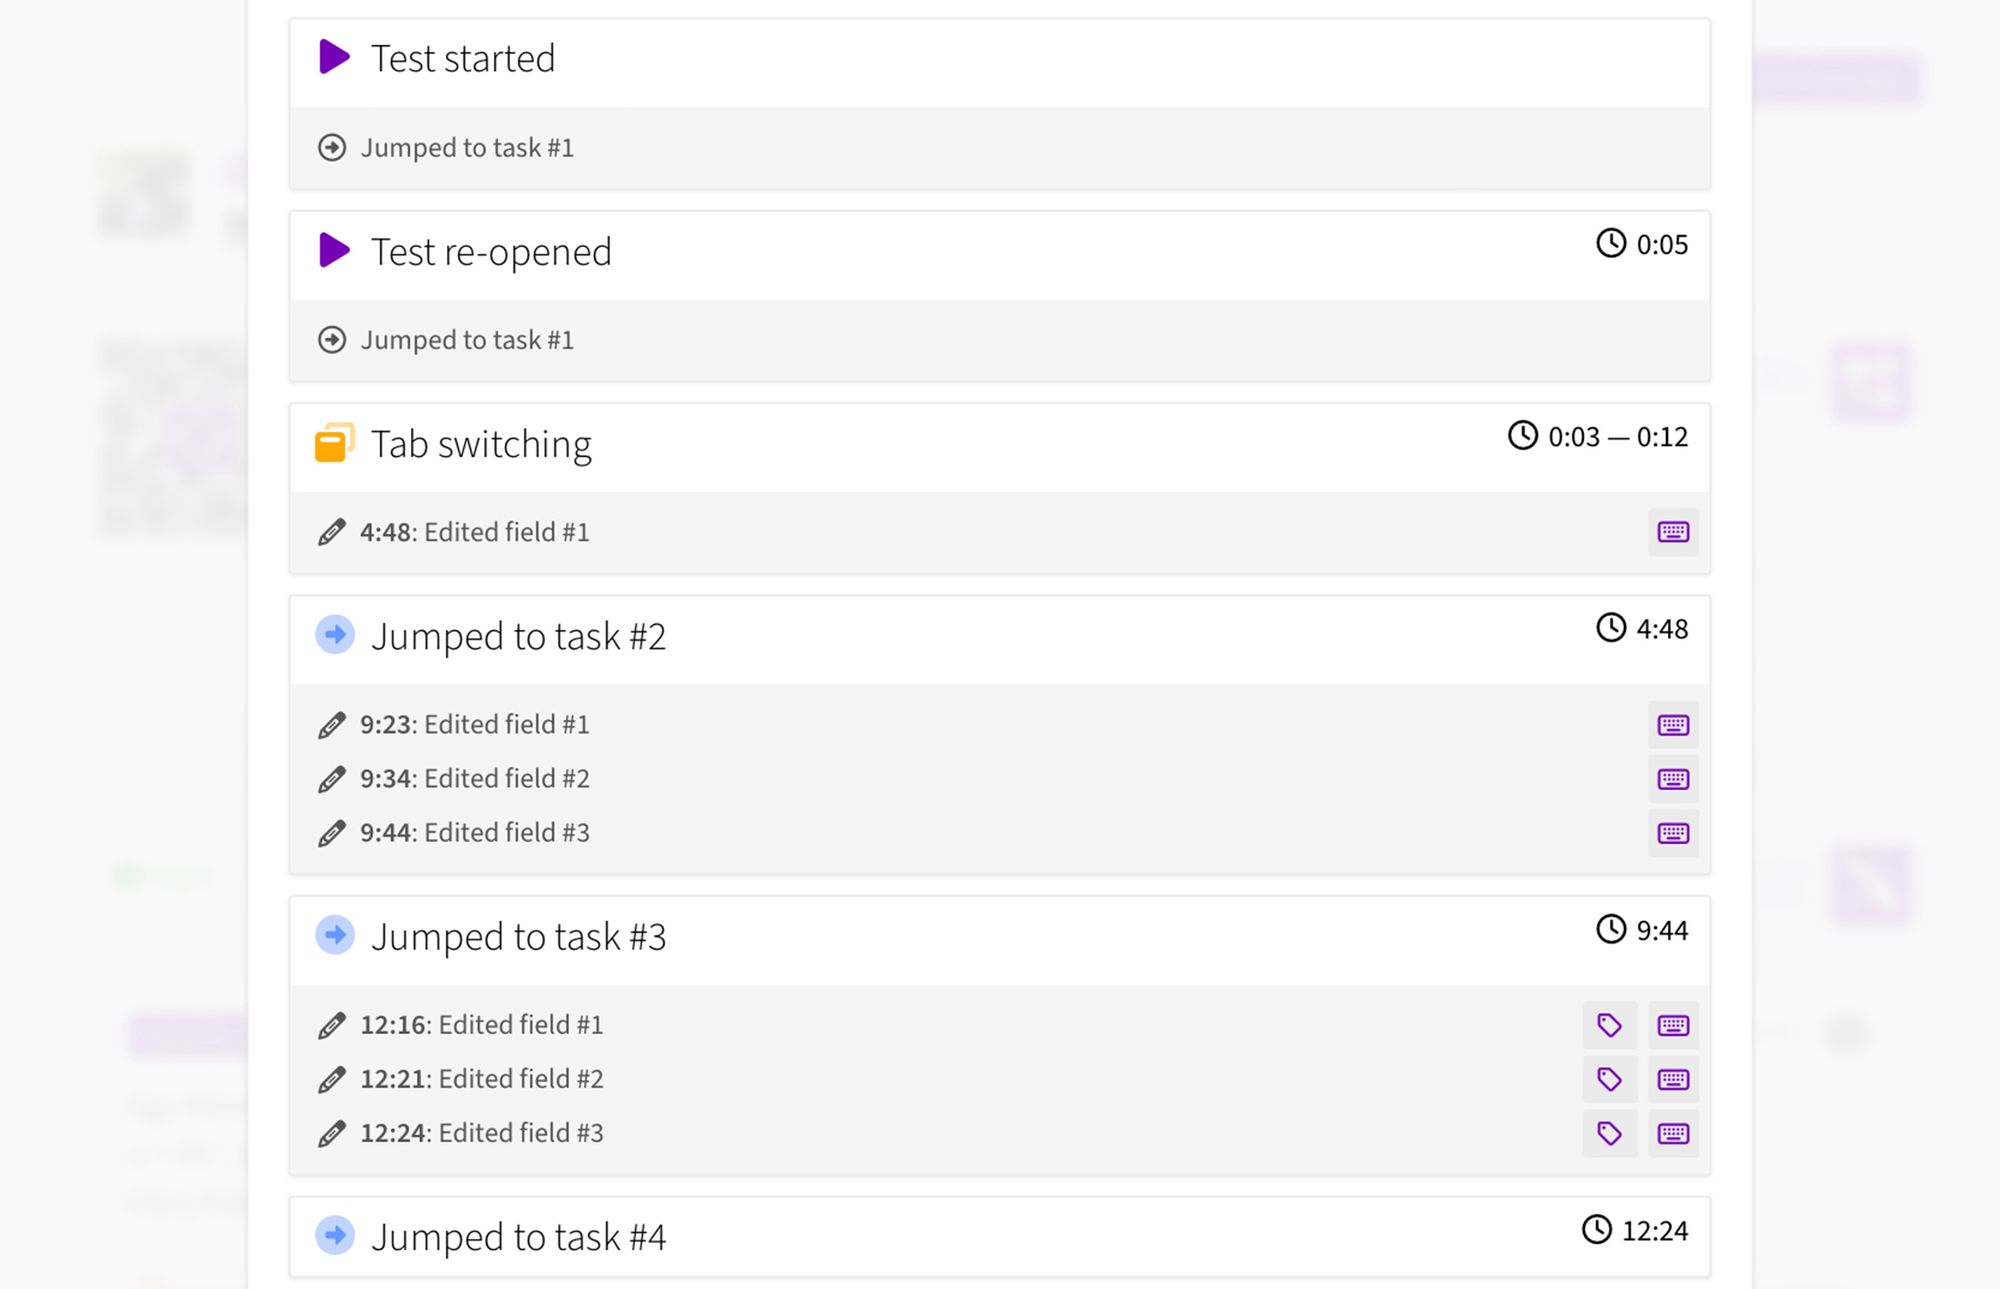
When designing and creating EduBase features, we are always focusing on collecting valuable metrics to provide even more insights (based on them) to our users. One such good example is how a test taker completes an exam. Not just the result, scores and the final grade they are given. We monitor what they do during the test, including but not limited to navigating between questions, editing answers, using test features, switching tabs, copy-pasting texts and so much more.

How to use these metrics
Educators might want to understand and analyze user behaviour during the tests. This can help revealing interesting facts:
- connections between tasks
for example if somehow one question helps solving another one - cheating
switching tabs, copy-pasting, screenshotting might be a sign of unwanted behaviour that you can detect - hardware or networking issues
repeated page reloads and offline events might help you verify if some users are experiencing technical issues - detailed timeline
EduBase not just delivers you total time of the test and used time per question but also an event log when a user "entered" or "exited" a question - detect patterns
based on the event log of individual results spot patterns at collective level
Even though here are some examples, we are always open to feedback and new ideas. Customers and users might bring us new ways to use these collected metrics.
Are you curious about your users?
If you want to use EduBase for your organization and try Quiz Flow, do not hesitate to let us know! You can either contact us and have a live demonstration of this or just simply try it on our homepage, www.edubase.net!
